Loading data...
Every year the US Center for Disease Control (CDC) conducts a national patient chart review with outpatient physicians. This study collects details for over 32,000 patient visits from 3,000 doctors in 15 major specialties.
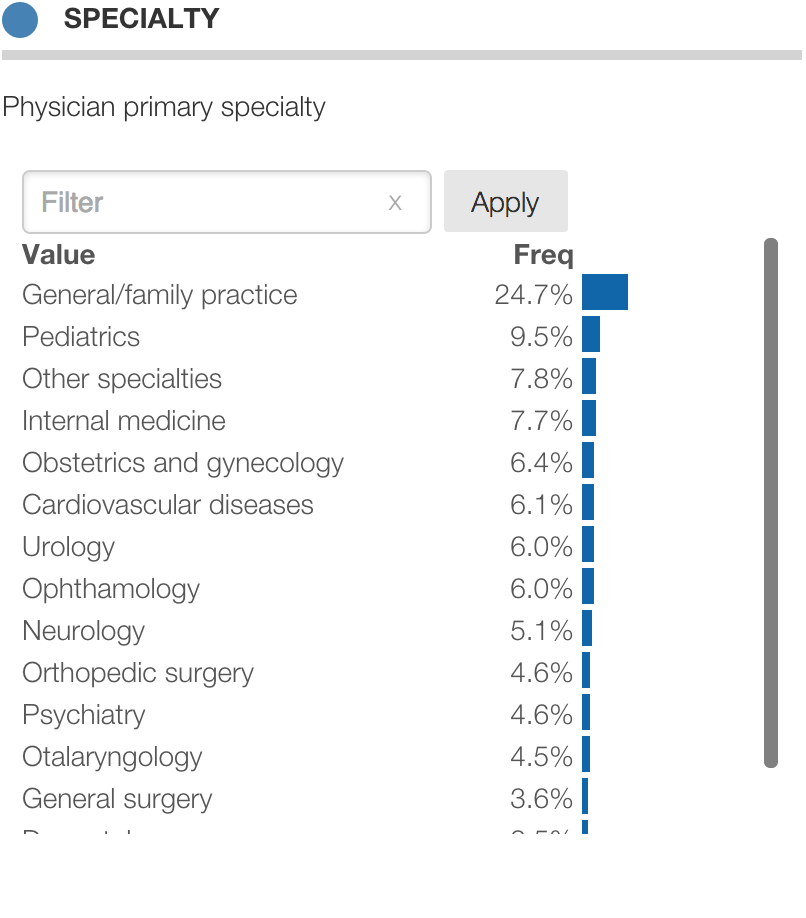
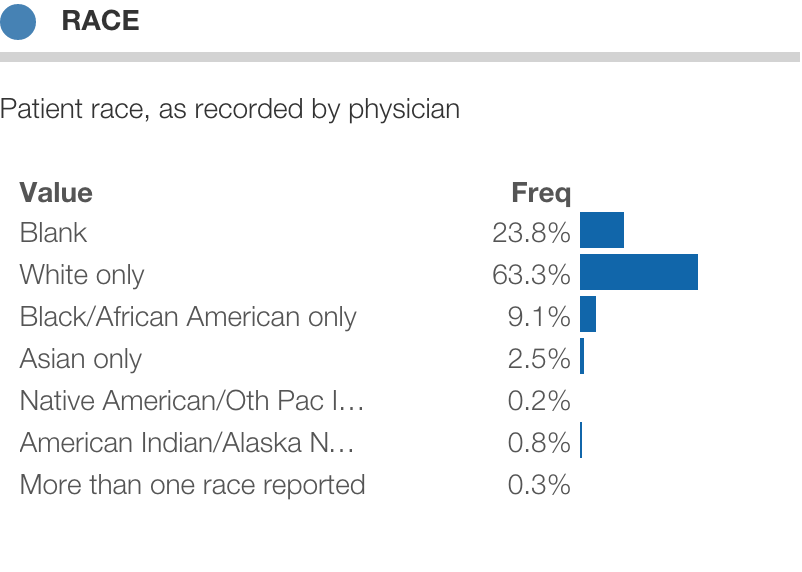
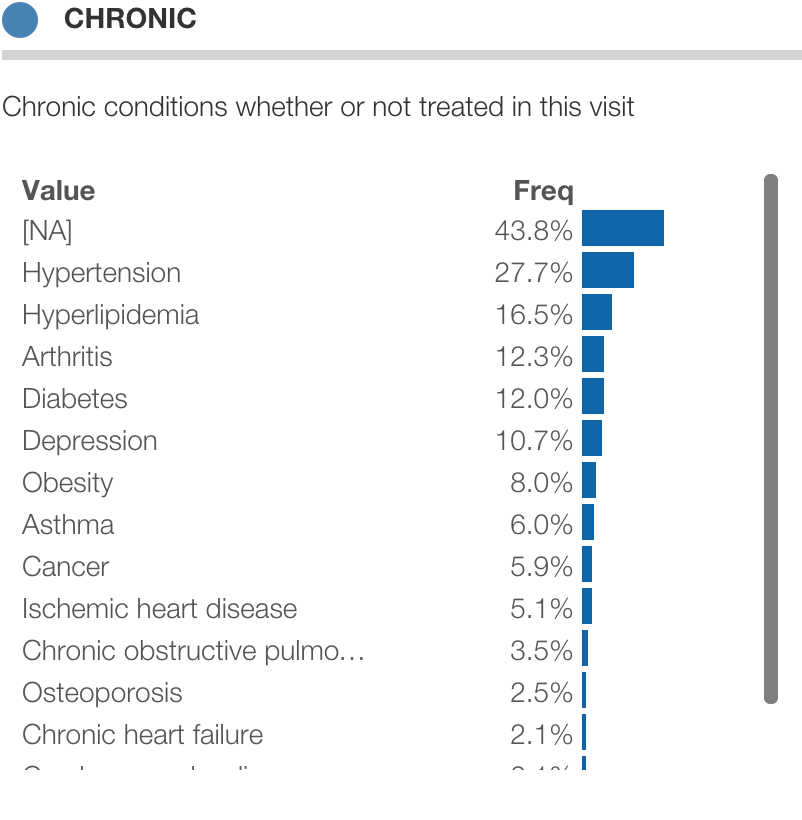
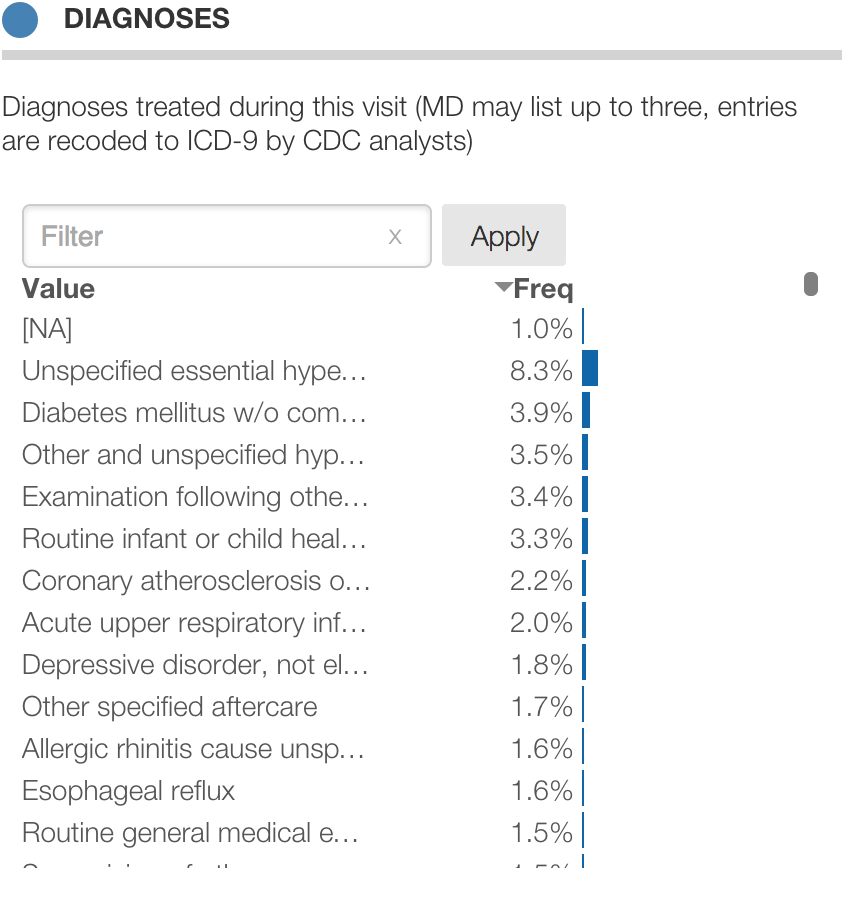
For each visit, the physician provides details on the patient's demographics, complaints, history, the physician's diagnoses, and medications provided, prescribed or continued.
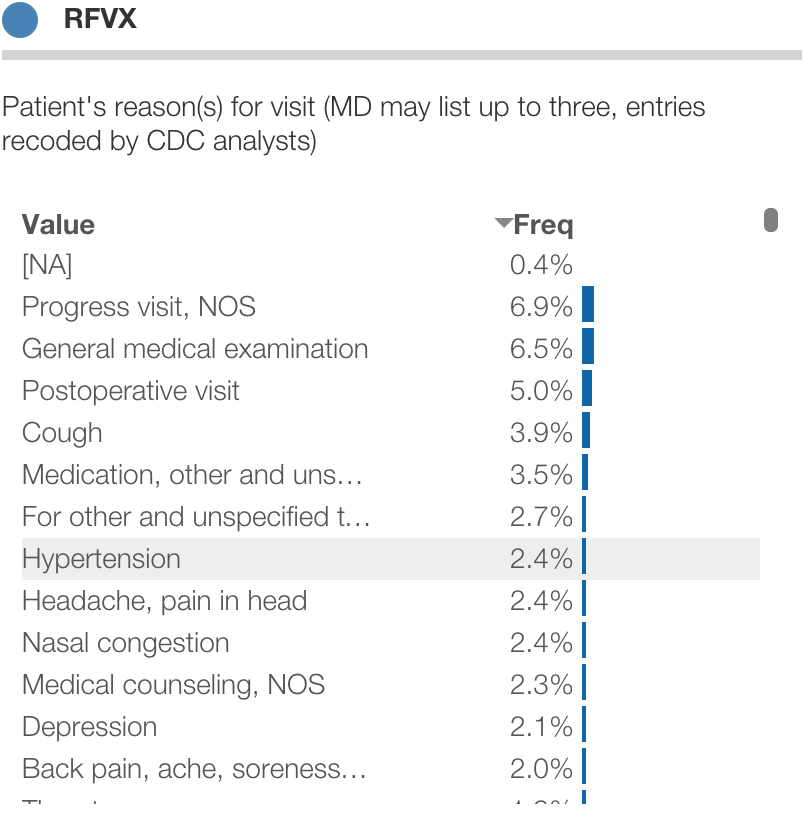
One unique feature of this dataset is it includes the patient's reason(s) for the visit. Given a complaint, such as a fever or sore throat, how often is that diagnosed as one condition versus another?
It's a weighted multilevel sample projectible to all US outpatient visits (i.e. not just commercially insured or Medicare patients). Read more about NAMCS on the CDC website .
Keep in mind this is a sample of visits not patients, so patients who visit more often are likely to appear in this sample. Also, NAMCS does not match each current medication to a specific current diagnosis.
Click to explore the data below in Protobi™. This page shows a few interesting fields for all 32,281 patient records in the 2009 NAMCS survey. Contact us at info@protobi.com for more information.
Follow your curiosity. Use the interface to explore questions like:

Click on any value to drill into specific patient subsets. Constrained values are shown with gold bars:
Use the toolbar buttons
Use the filter bars for search
lupus finds any condition containing the text "lupus".710 finds any condtion with ICD-9 code containing "710".itis|algia finds any condition containing "itis" or "algia"itis$ finds any condition that ends with "itis"^arth finds any condition that starts with "arth"Use baseline for reference
The current distribution is shown as blue or gold bars. The baseline distribution is shown as a light grey shadow for reference. Differences that are "significantly different" from baseline at p=0.05 are shown with triangle icons (simple Z-test of cell frequencies).
Initially the baseline includes all patients from all specialties. You can set this at any time by pressing the "Set base" button in the toolbar.
More questions? Check out our Tutorials or contact us at info@protobi.com.