Welcome to SERMO Dashboard Analytics
See, explore and export your
SERMO survey data

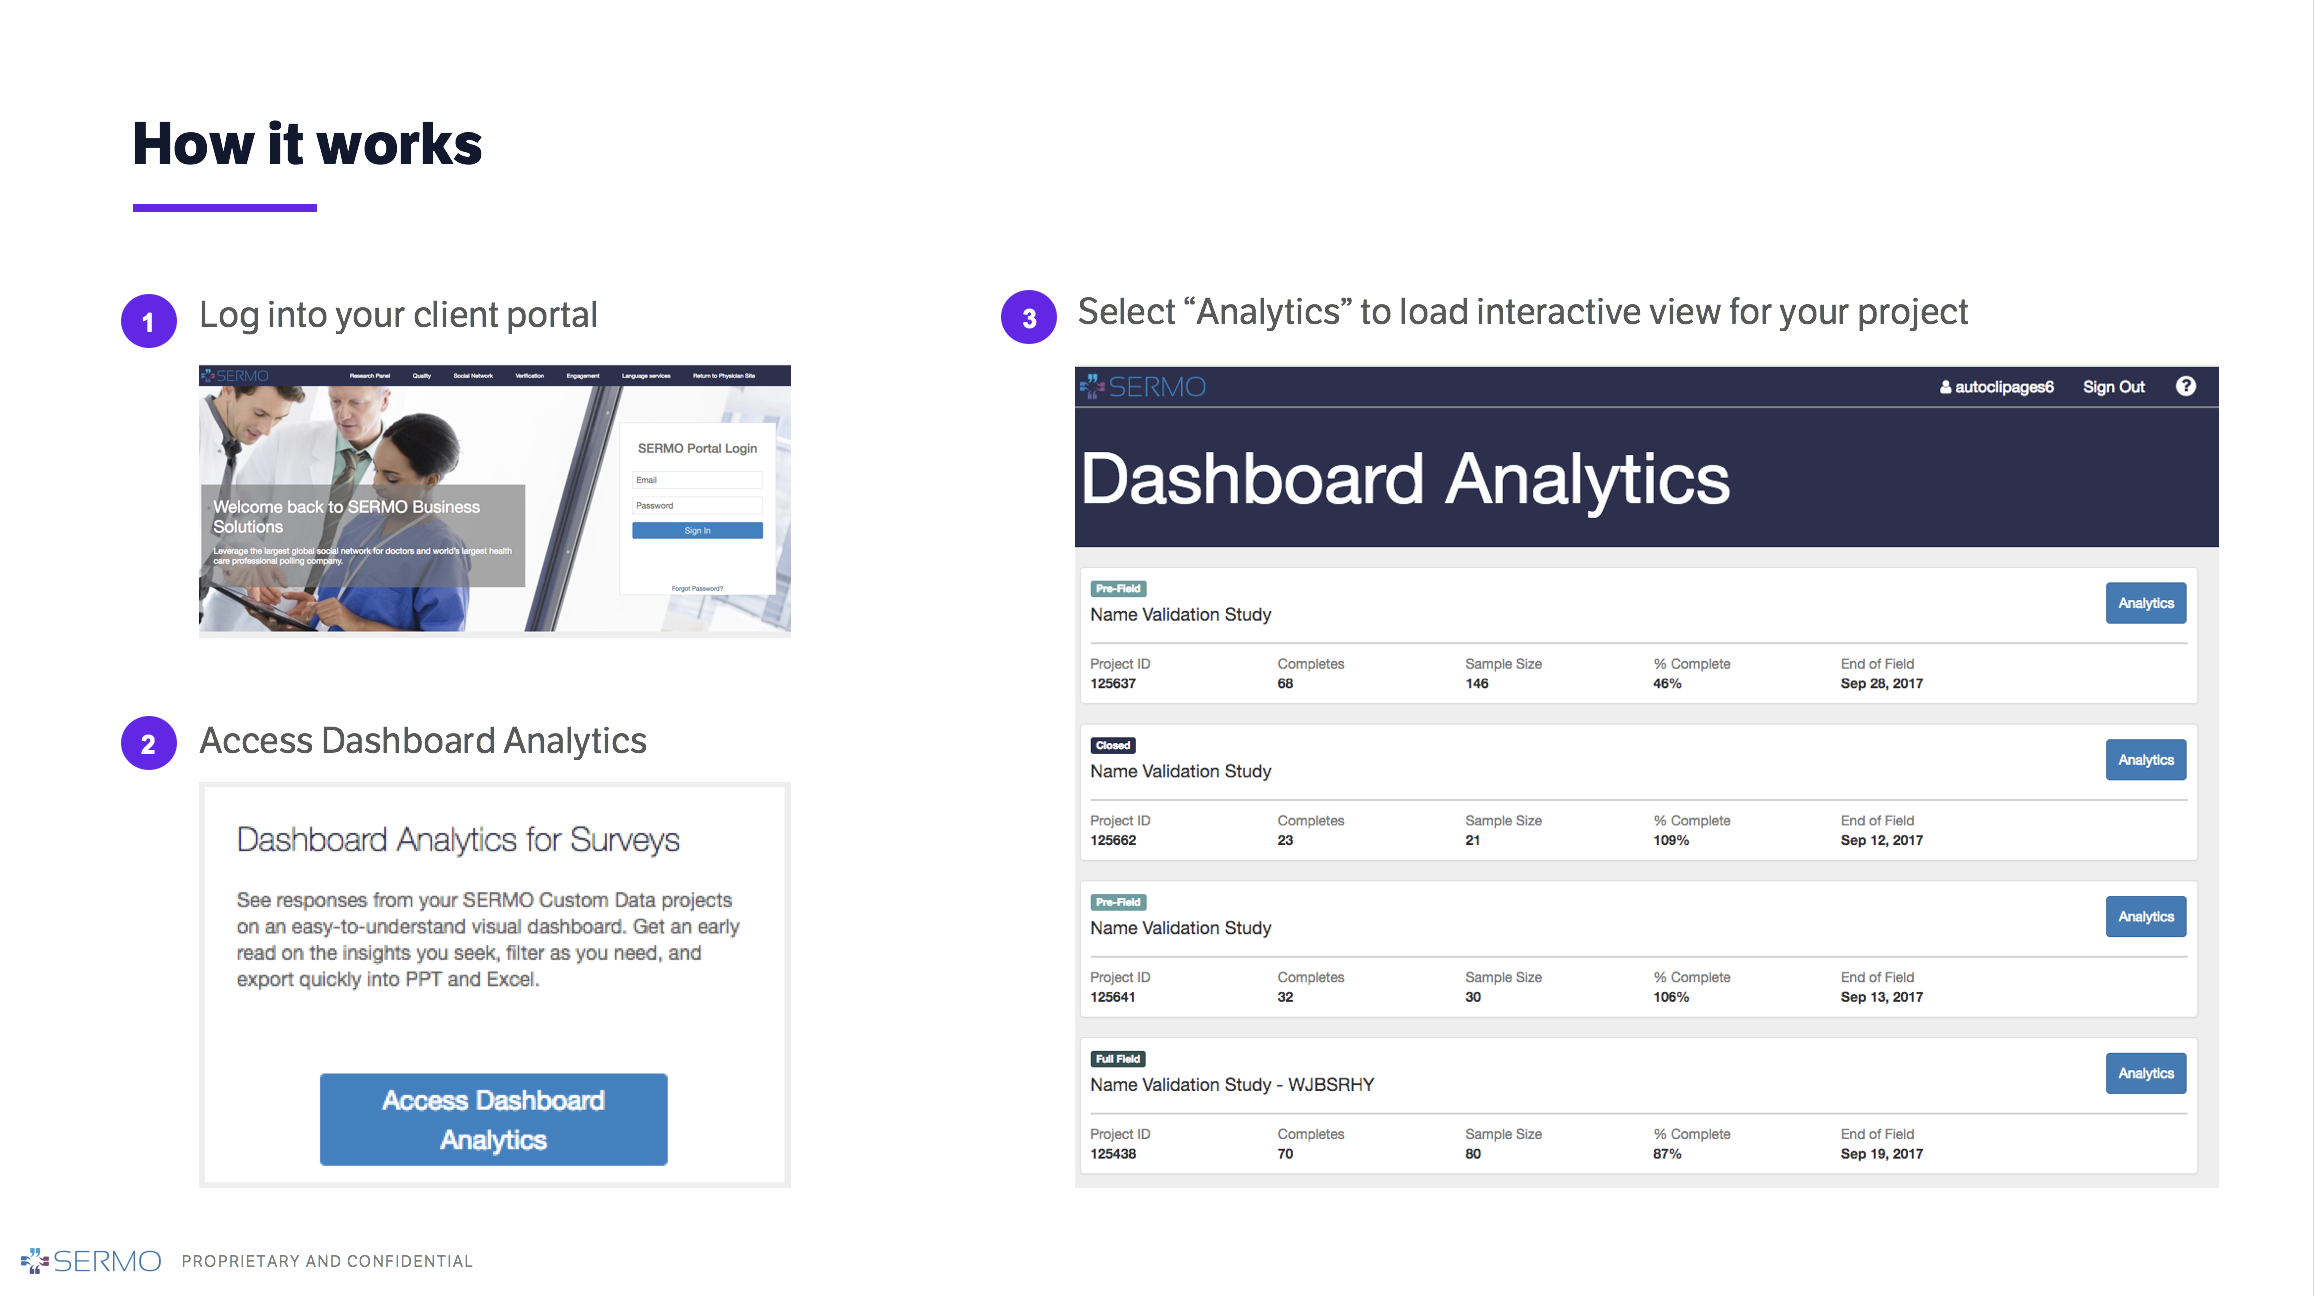
Open Analytics to see an interactive Protobi view of your entire survey, neatly set up automatically. You can filter responses, test hypotheses, run crosstabs, and export to PowerPoint, Excel and SPSS.

Optional capabilities let you edit the design, create advanced charts, do serious data processing, and collaborate online with colleagues and clients.

Intro video

A 1 minute intro to SERMO Dashboard Analytics:

Getting started

5 minute video showing how to use it:

Quick start presentation

Detailed tutorial on SERMO Dashboard Analytics

Additional capabilities
Included
Included with your SERMO survey now is everything you need to see, explore and download your data.
details...
  • Interactive Protobi® viewer
  • Explore and test hypotheses
  • Drag-and-drop crosstabs
  • Export as data to CSV and SPSS
  • Export as charts to PowerPoint & Excel
  • Expert software support

Editor
Add the ability to save changes so you and your team can design the view and make it your own.
details...
  • Save changes
  • Reorganize / design view
  • Code text verbatims
  • Zero-fill and scale values
  • Advanced charts
  • Cloud translation
  • Expert design worksession
Professional
Add the ability to clean, shape and recode the data and share with your clients, with expert assistance.
details...
  • Process data: clean, stack, merge...
  • Editor capabilities plus...
  • Calculate weights
  • Use your PowerPoint template
  • Invite your clients to view
  • Expert analyst support

Dashboard Analytics is powered by Protobi®, a SERMO software partner.

For more info, speak with your SERMO team or Schedule a demo